This section contains information about wind farm costs (both as lifetime costs and a detailed cost breakdown) and about levelised cost of energy (LCOE).
Costs
Site definitions
We have calculated a set of costs for a floating offshore wind farm, based on the following site conditions and assumptions:
| Guide categories | Rounded cost | Unit |
|---|---|---|
| Year of FID | 2028 | |
| First operation date | 2030 | |
| Wind farm rating | 1000 | MW |
| Turbine rating | 15 | MW |
| Water depth at site | 100 | m |
| Annual mean wind speed at 100 m height | 10 | m/s |
| Distance from offshore substation to shore | 75 | km |
| Distance from shore to onshore substation | 10 | km |
| Distance from wind farm to construction port | 75 | km |
| Distance from wind farm to O&M port | 75 | km |
| Floating substructure material and type | Steel semi-submersible | |
| Mooring system | 6 point mooring with drag embedment anchors | |
| Floating substructure manufacturing location | Asia | |
| Floating substructure assembly location | Europe | |
| Offshore substation foundation type | Fixed jacket foundation | |
| Ground conditions | Benign, allowing a piled substructure for the substation and drag embedment anchors for the floating offshore wind turbines |
| パラメーター | データ | 単位 |
|---|---|---|
| 最終投資決定 (FID) の年 | 2028 | |
| 最初の稼働日 | 2030 | |
| 風力発電所の定格出力 | 1000 | MW |
| タービン定格 | 15 | MW |
| サイトの水深 | 100 | m |
| 高度100m での年間平均風速 | 10 | m/s |
| 洋上変電所から海岸までの距離 | 75 | km |
| 海岸から陸上変電所までの距離 | 10 | km |
| 風力発電所から建設港までの距離 | 75 | km |
| 風力発電所から O&M ポートまでの距離 | 75 | km |
| 浮体式基礎構造物の材質と種類 | 鋼製セミサブ型 | |
| 係留施設 | ドラッグ式埋め込みアンカーによる 6 点係留 | |
| 浮体式基礎構造物の製造拠点 | アジア | |
| 浮体式基礎構造物の組み立て場所 | 欧州 | |
| 洋上変電所基礎の種類 | 着床式ジャケット基礎 | |
| 地盤条件 | 好適であり、変電所のパイル基礎構造物が使用可能であり、浮体式洋上風力タービンについてはドラッグ式埋め込みアンカーを使用可能 |
| 매개변수 | 데이터 | 단위 |
|---|---|---|
| FID 연도 | 2028 | |
| 최초 운영일 | 2030 | |
| 풍력발전단지 등급 | 1000 | MW |
| 터빈 등급 | 15 | MW |
| 부지 수심 | 100 | m |
| 100m 높이 연간 평균 풍속 | 10 | m/s |
| 해상 변전소부터 해안까지의 거리 | 75 | km |
| 해안에서 육상 변전소까지의 거리 | 10 | km |
| 풍력발전단지에서 건설 항구까지의 거리 | 75 | km |
| 풍력발전단지에서 O&M 항구까지의 거리 | 75 | km |
| 부유식 하부 구조믈 자재 및 유형 | 강철 반잠수식 | |
| 계류 장치 | 매립식 드래그 앵커를 사용한 6점 계류 방식 | |
| 부유식 하부 구조물 제조 위치 | 아시아 | |
| 부유식 하부 구조물 조립 위치 | 유럽 | |
| 해상 변전소 기초 구조물 유형 | 고정식 재킷 기초 구조물 | |
| 지면 조건 | 변전소의 파일형 하부 구조물 및 부유식 해상 풍력 터빈용 매립식 드래그 앵커가 가능할 만큼 양호해야 함 |
Lifetime costs
The pie chart below shows the contribution of each major cost element to the total lifetime cost of a floating offshore wind farm based on the site conditions and assumptions in the above table.
Detailed cost breakdown
A more detailed breakdown of typical costs is presented in the table below.
- All costs are real 2025 prices.
- Figures presented are rounded, hence totals may not equate to the sum of the sub-terms.
- There can be a range in prices of any element between projects, due to specific timing, local issues, exchange rates, competition and contracting conditions, so values stated should only be seen as indicative.
- Prices for large components include delivery to nearest port, and supplier and warranty costs.
- Developer costs (including internal project and construction management, insurance, typically spent contingency and overheads) are included in the highest-level boxes but are not itemised.
| Category | Rounded cost | Unit |
|---|---|---|
| Development and project management | 202,000 | $/MW |
| Development and consenting services | 94,000 | $/MW |
| Environmental impact assessments | 14,000 | $/MW |
| Development activities and other consenting services | 80,000 | $/MW |
| Environmental surveys | 11,000 | $/MW |
| Animal surveys (benthic, fish, shellfish, mammals and birds) | 10,000 | $/MW |
| Onshore environmental surveys | 2,000 | $/MW |
| Human impact studies | 1,000 | $/MW |
| Resource and metocean assessment | 9,000 | $/MW |
| Structure | 5,000 | $/MW |
| Sensors | 4,000 | $/MW |
| Maintenance | 1,000 | $/MW |
| Geological and hydrographical surveys | 12,000 | $/MW |
| Geophysical surveys | 3,000 | $/MW |
| Geotechnical surveys | 6,000 | $/MW |
| Hydrographic surveys | 2,000 | $/MW |
| Engineering and consultancy | 12,000 | $/MW |
| Project management | 63,000 | $/MW |
| Wind turbine | 1,755,000 | $/MW |
| Nacelle | 1,084,000 | $/MW |
| Rotor | 468,000 | $/MW |
| Tower | 202,000 | $/MW |
| Balance of plant | 3,143,000 | $/MW |
| Dynamic array cable | 149,000 | $/MW |
| Export cable | 350,000 | $/MW |
| Cable accessories | 104,000 | $/MW |
| Interface | 39,000 | $/MW |
| Cable protection | 5,000 | $/MW |
| Buoyancy | 3,000 | $/MW |
| Connectors and joints | 56,000 | $/MW |
| Floating substructure | 1,706,000 | $/MW |
| Structure | 1,434,000 | $/MW |
| Secondary steel | 68,000 | $/MW |
| Systems | 119,000 | $/MW |
| Corrosion protection | 85,000 | $/MW |
| Mooring systems | 411,000 | $/MW |
| Anchor systems | 45,000 | $/MW |
| Mooring lines and chains | 227,000 | $/MW |
| Jewellery | 128,000 | $/MW |
| Topside connection | 7,000 | $/MW |
| Installation aids | 4,000 | $/MW |
| Offshore substation | 366,000 | $/MW |
| HVAC electrical system | 104,000 | $/MW |
| Auxiliary systems | 17,000 | $/MW |
| Topside structure | 160,000 | $/MW |
| Foundation | 85,000 | $/MW |
| Onshore substation | 57,000 | $/MW |
| Electrical system | 40,000 | $/MW |
| Buildings, access and security | 17,000 | $/MW |
| Installation and commissioning | 1,789,000 | $/MW |
| Inbound transport | 200,000 | $/MW |
| Mooring and anchoring pre-installation | 199,000 | $/MW |
| Floating substructure - turbine assembly | 93,000 | $/MW |
| Crane and lifting equipment | 44,000 | $/MW |
| Technician services | 14,000 | $/MW |
| Marshalling port | 28,000 | $/MW |
| Other | 6,000 | $/MW |
| Floating substructure - turbine installation | 148,000 | $/MW |
| Offshore cable installation | 223,000 | $/MW |
| Onshore export cable installation | 11,000 | $/MW |
| Offshore substation installation | 68,000 | $/MW |
| Onshore substation construction | 38,000 | $/MW |
| Offshore logistics | 17,000 | $/MW |
| Sea-based support | 8,000 | $/MW |
| Marine coordination | 3,000 | $/MW |
| Weather forecasting and metocean data | 1,000 | $/MW |
| Marine safety and rescue | 6,000 | $/MW |
| Contingency and insurance | 793,000 | $/MW |
| Operation, maintenance and service | 127,000 | $/MW/Year |
| Operations, maintenance and service port | 1,000 | $/MW/Year |
| Operations | 44,000 | $/MW/Year |
| Operations control centre | 2,000 | $/MW/Year |
| Training | 3,000 | $/MW/Year |
| Onshore logistics | 2,000 | $/MW/Year |
| Technical resource (onshore and off) | 9,000 | $/MW/Year |
| Admin and support staff (onshore) | 10,000 | $/MW/Year |
| Insurance | 18,000 | $/MW/Year |
| Offshore logistics | 9,000 | $/MW/Year |
| Maintenance and service | 74,000 | $/MW/Year |
| Turbine maintenance and service | 53,000 | $/MW/Year |
| Balance of plant maintenance and service | 19,000 | $/MW/Year |
| Statutory inspections | 1,000 | $/MW/Year |
| Decommissioning | 584,000 | $/MW |
| Floating hull - turbine decommissioning | 193,000 | $/MW |
| Mooring and anchoring decommissioning | 159,000 | $/MW |
| Cable decommissioning | 178,000 | $/MW |
| Substation decommissioning | 54,000 | $/MW |
| ガイドのカテゴリー | 四捨五入後のコスト | 単位 |
|---|---|---|
| 開発とプロジェクトの管理 | 202,000 | $/MW |
| 開発および承認サービス | 94,000 | $/MW |
| 環境影響評価 | 14,000 | $MW |
| 開発活動およびその他の承認サービス | 80,000 | $/MW |
| 環境調査 | 11,000 | $/MW |
| 洋上生物種および生息地調査 | 10,000 | $/MW |
| 陸上環境調査 | 2,000 | $/MW |
| 人間活動影響調査 | 1,000 | $/MW |
| 風資源と気象海象評価 | 9,000 | $/MW |
| 構造物 | 5,000 | $/MW |
| センサー | 4,000 | $/MW |
| メンテナンス | 1,000 | $/MW |
| 地質・水文調査 | 12,000 | $/MW |
| 物理探査 | 3,000 | $/MW |
| 地質調査 | 6,000 | $/MW |
| 水文調査 | 2,000 | $/MW |
| エンジニアリングとコンサルティング | 12,000 | $/MW |
| プロジェクト管理 | 63,000 | $/MW |
| 風力タービン | 1,755,000 | $/MW |
| ナセル | 1,084,000 | $/MW |
| ローター | 468,000 | $/MW |
| タワー | 202,000 | $/MW |
| 周辺設備 | 3,143,000 | $/MW |
| アレイ ケーブル | 149,000 | $/MW |
| エクスポートケーブル | 350,000 | $/MW |
| ケーブル付属品 | 104,000 | $/MW |
| インターフェース (接続) | 39,000 | $/MW |
| ケーブル保護 | 5,000 | $/MW |
| 浮力 | 3,000 | $/MW |
| コネクタとジョイント | 56,000 | $/MW |
| 浮体式基礎構造物 | 1,706,000 | $/MW |
| 一次鋼構造物 | 1,434,000 | $/MW |
| 二次鋼構造物 | 68,000 | $/MW |
| 基礎構造物補助システム | 119,000 | $/MW |
| 腐食保護 | 85,000 | $/MW |
| 係留施設 | 411,000 | $/MW |
| アンカー | 45,000 | $/MW |
| 係留索 | 227,000 | $/MW |
| 接続ジョイント | 128,000 | $/MW |
| 上部接続部 | 7,000 | $/MW |
| 設置補助 | 4,000 | $/MW |
| 洋上変電所 | 366,000 | $/MW |
| 高圧交流 (HVAC) 電気システム | 104,000 | $/MW |
| 補助システム | 17,000 | $/MW |
| 上部構造物 | 160,000 | $/MW |
| 基礎構造物 | 85,000 | $/MW |
| 陸上変電所 | 57,000 | $/MW |
| 電気システム | 40,000 | $/MW |
| 建物、アクセス、警備体制 | 17,000 | $/MW |
| 設置と試運転 | 1,789,000 | $/MW |
| 搬入輸送 | 200,000 | $/MW |
| アンカーと係留策の事前設置 | 199,000 | $/MW |
| 浮体式基礎構造物 - タービンアセンブリ | 93,000 | $/MW |
| 重量物吊り上げ・移動設備 | 44,000 | $/MW |
| 技術者サービス | 14,000 | $/MW |
| マーシャリング港湾 | 28,000 | $/MW |
| その他 設置 | 6,000 | $/MW |
| 浮体式基礎構造物 - タービン設置 | 148,000 | $/MW |
| 洋上ケーブル敷設 | 223,000 | $/MW |
| 陸上エクスポートケーブルの敷設 | 11,000 | $/MW |
| 洋上変電所の設置 | 68,000 | $/MW |
| 陸上変電所の建設 | 38,000 | $/MW |
| 洋上物流 | 17,000 | $/MW |
| 海上支援 | 8,000 | $/MW |
| マリンコーディネーション | 3,000 | $/MW |
| 天気予報と気象海象データ | 1,000 | $/MW |
| 海上安全と救助 | 6,000 | $/MW |
| 不測の事態への予備費と保険 | 793,000 | $/MW |
| 運用、保守管理、サービス | 127,000 | $/MW/年 |
| 運用、保守、サービス港湾 | 1,000 | $/MW/年 |
| オペレーション | 44,000 | $/MW/年 |
| 運用管理センター | 2,000 | $/MW/年 |
| トレーニング | 3,000 | $/MW/年 |
| 陸上ロジスティクス | 2,000 | $/MW/年 |
| 技術リソース (陸上および洋上) | 9,000 | $/MW/年 |
| 管理者およびサポートスタッフ (陸上) | 10,000 | $/MW/年 |
| 保険 | 18,000 | $/MW/年 |
| 洋上アクセス船とロジスティクス | 9,000 | $/MW/年 |
| メンテナンスとサービス | 74,000 | $/MW/年 |
| タービン保守管理・サービス | 53,000 | $/MW/年 |
| 周辺設備のメンテナンスおよびサービス | 19,000 | $/MW/年 |
| 法定検査 | 1,000 | $/MW/年 |
| 廃止 | 584,000 | $/MW |
| 浮体式基礎構造物 - タービンの廃止 | 193,000 | $/MW |
| 係留およびアンカーの廃止 | 159,000 | $/MW |
| ケーブルの廃止 | 178,000 | $/MW |
| 変電所の廃止 | 54,000 | $/MW |
| 가이드 범주 | 반올림한 비용 | 단위 |
|---|---|---|
| 개발 및 프로젝트 관리 | 202,000 | $/MW |
| 개발 및 인허가 서비스 | 94,000 | $/MW |
| 환경영향평가(EIA) | 14,000 | $/MW |
| 개발 활동 및 기타 인허가 서비스 | 80,000 | $/MW |
| 환경 조사 | 11,000 | $/MW |
| 동물 조사(저서생물, 어류, 조개류, 포유류, 조류) | 10,000 | $/MW |
| 육상 환경 조사 | 2,000 | $/MW |
| 인체 영향 연구 | 1,000 | $/MW |
| 자원 및 해양기상 환경 평가 | 9,000 | $/MW |
| 구조물 | 5,000 | $/MW |
| 센서 | 4,000 | $/MW |
| 유지보수 | 1,000 | $/MW |
| 지질 및 수로 조사 | 12,000 | $/MW |
| 물리탐사 | 3,000 | $/MW |
| 지질탐사 | 6,000 | $/MW |
| 수로 측량 | 2,000 | $/MW |
| 엔지니어링 및 컨설팅 | 12,000 | $/MW |
| 프로젝트 관리 | 63,000 | $/MW |
| 풍력 터빈 | 1,755,000 | $/MW |
| 나셀 | 1,084,000 | $/MW |
| 로터 | 468,000 | $/MW |
| 타워 | 202,000 | $/MW |
| 발전보조기기 | 3,143,000 | $/MW |
| 동적 내부망 | 149,000 | $/MW |
| 외부망 | 350,000 | $/MW |
| 케이블 부속품 | 104,000 | $/MW |
| 인터페이스 | 39,000 | $/MW |
| 케이블 보호재 | 5,000 | $/MW |
| 부력체 | 3,000 | $/MW |
| 커넥터 및 접합 장치 | 56,000 | $/MW |
| 부유식 하부 구조물 | 1,706,000 | $/MW |
| 구조물 | 1,434,000 | $/MW |
| 보조 강철 구조물 | 68,000 | $/MW |
| 시스템 | 119,000 | $/MW |
| 부식 방지 | 85,000 | $/MW |
| 계류 장치 | 411,000 | $/MW |
| 앵커 시스템 | 45,000 | $/MW |
| 계류삭과 체인 | 227,000 | $/MW |
| 부속품(Jewellery) | 128,000 | $/MW |
| 상부 연결장치 | 7,000 | $/MW |
| 설치 보조 도구 | 4,000 | $/MW |
| 해상 변전소 | 366,000 | $/MW |
| HVAC 전기 시스템 | 104,000 | $/MW |
| 보조 설비 | 17,000 | $/MW |
| 상부 구조물 | 160,000 | $/MW |
| 기초 구조물 | 85,000 | $/MW |
| 육상 변전소 | 57,000 | $/MW |
| 전기 시스템 | 40,000 | $/MW |
| 건물, 접근 시설, 보안 | 17,000 | $/MW |
| 설치 및 시운전 | 1,789,000 | $/MW |
| 인바운드 운송 | 200,000 | $/MW |
| 계류 및 앵커링 사전 설치 | 199,000 | $/MW |
| 부유식 하부 구조물 - 터빈 조립 | 93,000 | $/MW |
| 크레인 및 인양 장비 | 44,000 | $/MW |
| 엔지니어 제공 | 14,000 | $/MW |
| 집하 항구 | 28,000 | $/MW |
| 기타 | 6,000 | $/MW |
| 부유식 하부 구조물 - 터빈 설치 | 148,000 | $/MW |
| 해상 케이블 설치 | 223,000 | $/MW |
| 육상 외부망 설치 | 11,000 | $/MW |
| 해상 변전소 설치 | 68,000 | $/MW |
| 육상 변전소 건설 | 38,000 | $/MW |
| 해상 물류 | 17,000 | $/MW |
| 해상 지원 | 8,000 | $/MW |
| 해양 조정 활동 | 3,000 | $/MW |
| 일기 예보 및 해상기상 데이터 | 1,000 | $/MW |
| 해양 안전 및 구조 활동 | 6,000 | $/MW |
| 비상 상황 및 보험 | 793,000 | $/MW |
| 작동, 유지보수, 정비 | 127,000 | $/MW/년 |
| 작동, 유지보수, 정비 항만 | 1,000 | $/MW/년 |
| 운영 | 44,000 | $/MW/년 |
| 운영 제어 센터 | 2,000 | $/MW/년 |
| 교육 | 3,000 | $/MW/년 |
| 육상 물류 | 2,000 | $/MW/년 |
| 기술 리소스(육상 및 해상) | 9,000 | $/MW/년 |
| 관리 및 지원 인력(육상) | 10,000 | $/MW/년 |
| 보험 | 18,000 | $/MW/년 |
| 해상 물류 | 9,000 | $/MW/년 |
| 유지보수 및 정비 | 74,000 | $/MW/년 |
| 터빈 유지보수 및 정비 | 53,000 | $/MW/년 |
| 발전보조기기 유지보수 및 정비 | 19,000 | $/MW/년 |
| 법정 검사 | 1,000 | $/MW/년 |
| 해체 | 584,000 | $/MW |
| 부유식 선체 - 터빈 해체 | 193,000 | $/MW |
| 계류 및 앵커링 해체 | 159,000 | $/MW |
| 케이블 해체 | 178,000 | $/MW |
| 변전소 해체 | 54,000 | $/MW |
Levelised cost of energy
Purpose of LCOE
LCOE is defined as the revenue required (from whatever source) to earn a rate of return on investment equal to the discount rate (also referred to as the weighted average cost of capital (WACC) over the life of the wind farm. Tax and inflation are not modelled. In other words, it is the lifetime average cost for the energy produced.
LCOE is used to evaluate and compare the cost of electricity production from different technologies and at different locations. It is a good way to compare the cost of a unit of energy (say in dollars per megawatt hour of electricity ($/MWh)) produced. LCOE does not consider costs relating to balancing supply and demand.
Lower LCOE benefits the electricity consumer (and tax payers if any subsidy is paid to generators), so decreasing LCOE is a key focus for the offshore wind industry.
LCOE combines costs and energy production into one metric, rather than comparing cost and energy production separately. It is used by technology players and industry enablers, but typically not by project investors who may be more interested in internal rate of return (IRR) or net present value (NPV) of an investment, taking into account more company-specific features like tax.
In the UK, subsidy for offshore wind farms is currently provided through UK Government Contract for Difference (CfD) auctions. CfD bid price is the revenue ($/MWh) sought by the developer for a 15 year duration. Revenue after this will come from the open market. The bidder’s prediction of future market prices and its approach to risk and competition will determine how it sets its CfD bid price. The CfD bid price therefore is not equal to LCOE, though there is a relationship between the two. In different markets, the scope of supply of the project developer and the terms of the competition vary, meaning that there is a different relationship between CfD bid price and LCOE.
In Japan, subsidies for offshore wind farms are provided through Public Auction System for Offshore Renewable Energy, established under the Renewable Energy Sea Area Utilization Act (2019). Auctions are conducted by the Ministry of Economy, Trade and Industry (METI) and the Ministry of Land, Infrastructure, Transport and Tourism (MLIT). Developers bid by proposing a supply price (¥/kWh) for a fixed contract period, typically 20 years. After this period, revenue will be determined by market conditions. The bid price is influenced by the developer’s expectations of future electricity prices, risk management strategy, and competitive positioning. Therefore, the bid price is not necessarily equal to the levelised cost of electricity (LCOE), though there is a correlation between the two. The relationship between bid price and LCOE varies depending on market structure, project scope, and auction rules in different regions.
In South Korea, offshore wind subsidies are provided through the Renewable Portfolio Standard (RPS) and the Feed-in-Premium (FIP) scheme, managed by the Ministry of Trade, Industry, and Energy (MOTIE). Unlike competitive auctions in other markets, South Korea’s RPS requires large utilities to source a set percentage of electricity from renewables. Developers earn revenue through Renewable Energy Certificates (RECs) and electricity sales, with offshore wind projects benefiting from higher REC multipliers. Introduced in 2022, the FIP scheme offers a premium above the wholesale market price instead of a fixed tariff, allowing for market-driven pricing. Bid prices reflect forecasts of electricity prices, risk strategies, and competition rather than directly equating to the levelised cost of electricity (LCOE), though a correlation exists. South Korea is transitioning toward competitive bidding for offshore wind, with a roadmap outlining a two-stage evaluation process that considers both price and non-price factors. This shift may reshape the current RPS and FIP frameworks, impacting project economics and investment dynamics.
Definition of LCOE
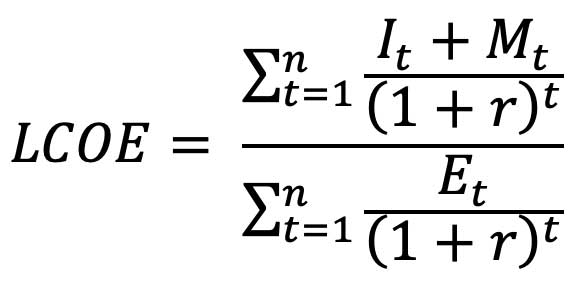
The technical definition of LCOE is:
Where:
It Investment expenditure in year t
Mt Operation, maintenance and service expenditure in year t
Et Energy generation in years t
r Discount rate (or WACC), and
n Lifetime of the project in years.
Drivers of LCOE
LCOE reduction can come from reduced costs, increased energy production, or changes in financing and lifetime of the project. Reduced cost can result from process or technology changes during the manufacturing, installation or operations phase. Increased energy production may result from technology or by reducing lost energy via better operational processes. Reducing project risk is the main way to affect financing cost.
The chart below shows BVGA’s LCOE forecast for floating offshore wind from 2027 (when the next pre-commercial floating offshore wind farms in the UK are expected to be commissioned) to 2035. LCOE varies between individual projects but overall LCOE is continuing to reduce significantly over time. The band shows the variance in LCOE that could occur for floating offshore wind projects driven by different site conditions, support mechanisms and local requirements that all impact LCOE. The variance is expected to tighten over time as the industry standardises across different technologies, and their associated manufacturing, installation and maintenance processes. The cost breakdown shown below reflects the higher commodity prices and altered market dynamics experienced by the industry post-2020. While some level of reduction in future commodity prices is expected, it is unclear on the timing or magnitude of this.
Some of the key drivers of cost are:
Site conditions
In waters less than 70 m deep, the mooring of some floating substructure types becomes more expensive because of the dynamic response to waves in these shallower waters.
Easy ground conditions, such as dense sand with low gradients or homogeneous or stiff clay containing few or no boulders, offer cost benefits because a range of anchoring solutions can be used and there is high confidence of long-term mooring system stability. Difficult conditions can add to cost significantly by driving a need for alternative designs and installation methods, such as suction or piled anchors.
Wind and wave conditions, tidal ranges and tidal flows also impact LCOE. Higher mean wind speeds increase cost but have a net benefit for LCOE due to increased energy production. In Japan and South Korea, typhoon winds could drive design changes that add cost. Large tidal ranges can add to cost because turbines are required to keep a minimum clearance from sea level to blade tip at all times and so require more flexibility in the mooring system. Tides and waves make it harder to access turbines, especially for unplanned maintenance and repair activities in bad weather, adding cost and reducing energy production.
Likewise, projects further from shore take longer to access which adds cost and increases downtime, which reduces energy production. At about 60 km, it may be most cost effective to use a service operation vessel (SOV) spending weeks at sea, rather than crew transfer vessels (CTVs) travelling to and from port daily. Projects further from shore typically also have longer grid connections, adding to transmission CAPEX and OPEX.
Over time, there has been a move by governments from providing an agreed fixed-value market mechanism to supporting offshore wind to auctions where project developers bid a price for electricity they will generate. This change drives competition at project level which is passed down through the supply chain. Also, as the industry matures, what used to be highly differentiated areas of supply become commodities, driving further competition.
In some supply chain areas, such as turbine supply, the market is not big enough to have more than a handful of suppliers competing globally. This limits competition. In other areas, such as cables and foundations, transport costs are low enough to enable a geographically diverse supply base to bid for supply. In locations where ports have drafts suitable for floating substructure-turbine installation and can support the provision of O&M port services, distance to the wind farm is key which localises competition.
Vessel charter prices are a good example of the impact of pan-sector competition. Whether considering large floating vessels or common tugs, cyclic variations in regional wind and oil and gas activity can have a significant effect of price.
Supply chain evolution
Over time, the supply chain will mature, as it did in fixed offshore wind, with larger players taking on wider scopes and more risk. Wider scope within one supplier has enabled more cross-disciplinary collaboration to reduce cost. Also, larger volumes have facilitated investment in design, manufacturing and installation tooling suited to higher-volume process repetition. Large offshore wind farms may use 100 sets of identical (or similar) components, quite different from the more common practice in oil and gas of constructing one-offs.
Technology development
To date, the biggest driver over time of cost of energy reduction has been the development of new technology. The most visible sign of this has been the increase in turbine rating, increasing from 2 MW turbines 20 years ago to 15 MW turbines for projects reaching FID in 2028.
Larger turbines help drive down the per MW cost of floating substructures, installation and operation, whilst reaching higher into the wind field, so increasing energy production per MW installed. Larger turbines drive a need for technology development at a component level, as offshore wind turbines use the largest castings, bearings, generators and composite structures in series manufacture in any industry.
Technology development in floating substructure design and manufacture will have a major impact on LCOE. This cost element is specific to floating offshore wind and currently makes up a very large proportion of CAPEX. As the industry scales up and optimises floating substructures, significant cost reductions will happen, just as they have for cost components in fixed offshore wind. Innovations in foundation substructures, such as lighter, more optimised designs, will reduce the amount of steel and other materials needed, lowering material and fabrication costs. Integration between turbine and foundation design could also help reduce costs. As the industry scales up, economies of scale and streamlined supply chains will further drive down costs. Additionally, increased project experience, and improved installation technologies, will contribute to making floating offshore wind more affordable and commercially viable over time, although this is dependent on deployment rates.
Industry incorporation of digital, autonomous, artificial intelligence and other applicable technologies is also enabling significant cost reduction, especially through improved wind farm operation and control.
Time
Considering the supply chain and technical factors described above, LCOE is projected to reduce over time.
The chart below shows BVGA’s LCOE forecast for European floating offshore wind from 2027 (when the next pre-commercial floating offshore wind farms in the UK are expected to be commissioned) to 2035. We expect LCOE in the Asia Pacific region to follow a similar trend, although absolute values may change. LCOE varies between individual projects but overall LCOE is continuing to reduce significantly over time. The band shows the variance in LCOE that could occur for floating offshore wind projects driven by different site conditions, support mechanisms and local requirements that all impact LCOE. The variance is expected to tighten over time as the industry standardises across different technologies, and their associated manufacturing, installation and maintenance processes. The cost breakdown shown below reflects the higher commodity prices and altered market dynamics experienced by the industry post-2020. While some level of reduction in future commodity prices is expected, it is unclear on the timing or magnitude of this.
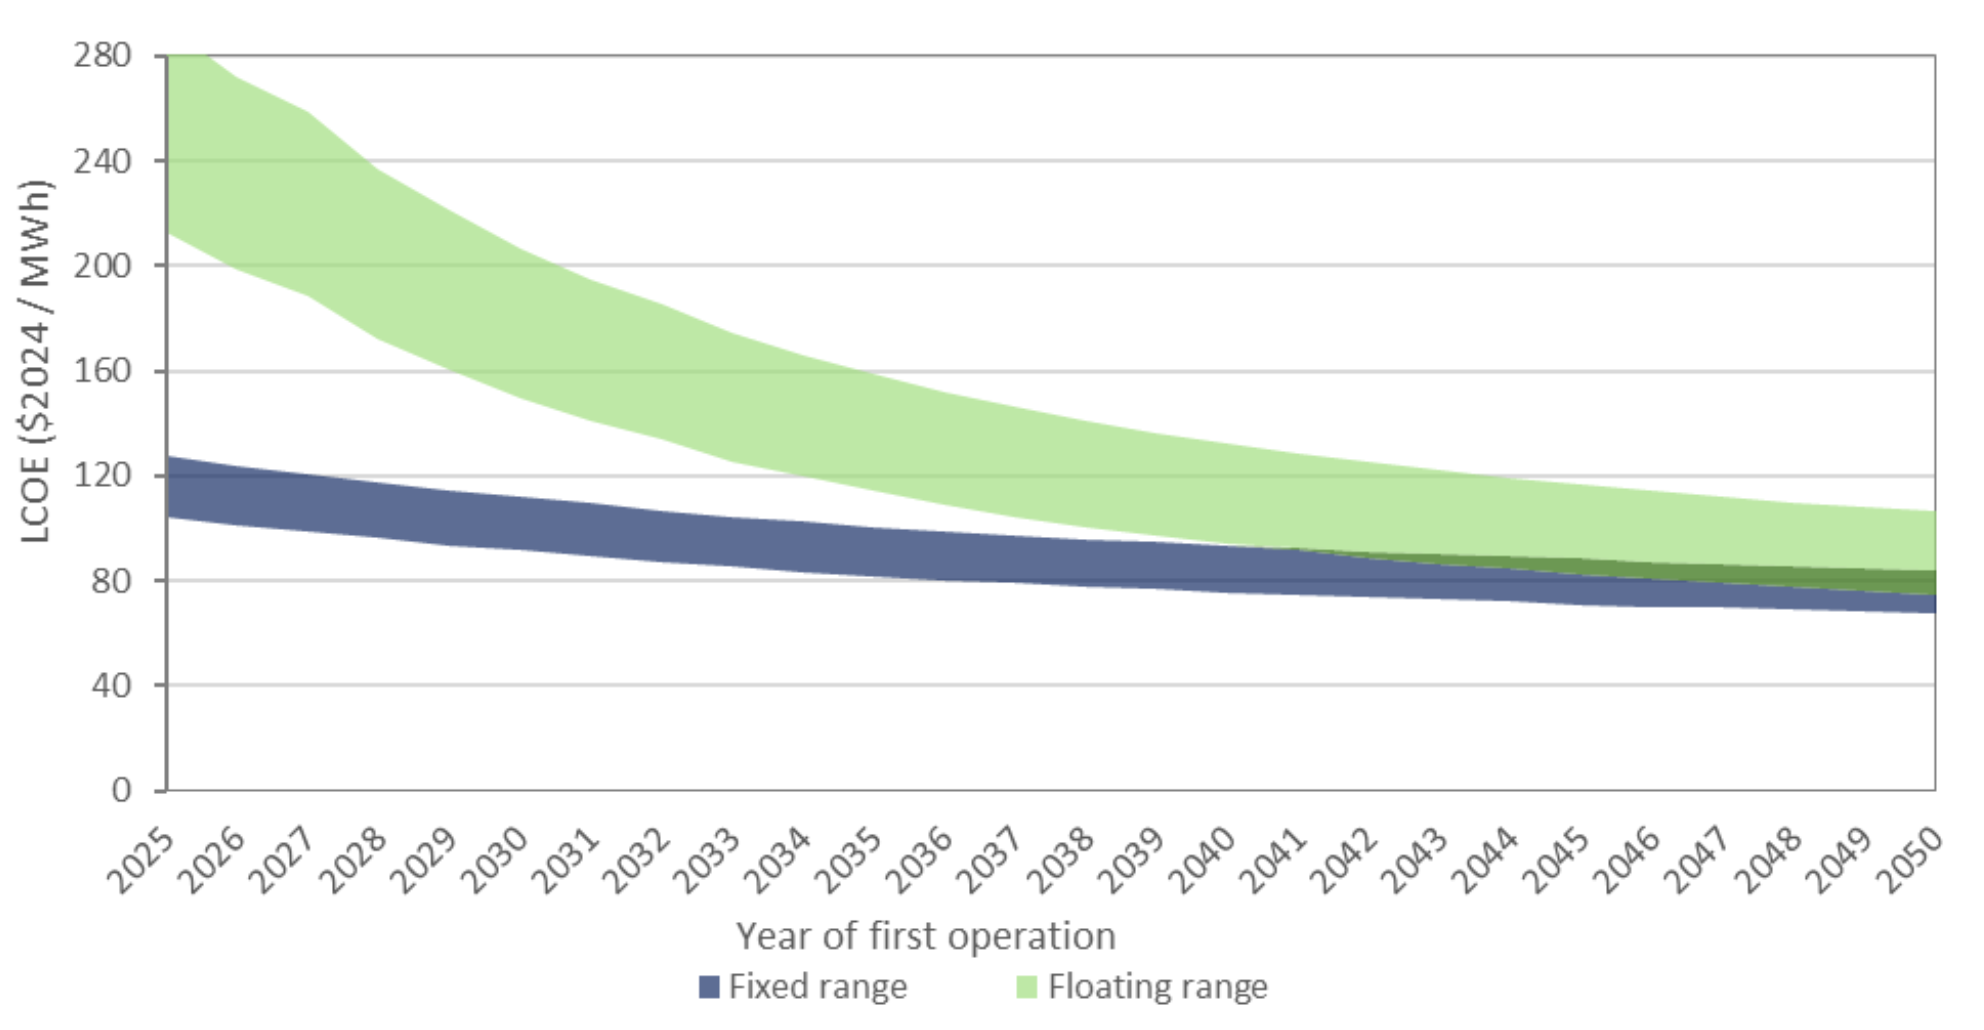
While the LCOE of floating offshore wind is expected to decline significantly as the industry scales and technology matures, it is likely to remain higher than fixed-bottom offshore wind in most cases. Even as economies of scale and innovation reduce the LCOE for floating wind, the inherent technical challenges and material requirements will continue to make it more expensive than fixed-bottom projects. This is largely due to the added complexity of floating foundations, mooring systems, and dynamic cabling, as well as the need for specialised installation and maintenance strategies in deeper waters. Further, fixed and floating offshore wind have different deployment locations. Floating wind is designed to access deeper waters and more technically challenging sites that fixed-bottom technologies cannot reach. These locations often involve harsher metocean conditions, greater infrastructure demands, and more complex engineering requirements leading to higher costs.